Visualizing gigabytes of geospatial data in your browser
11 May 2016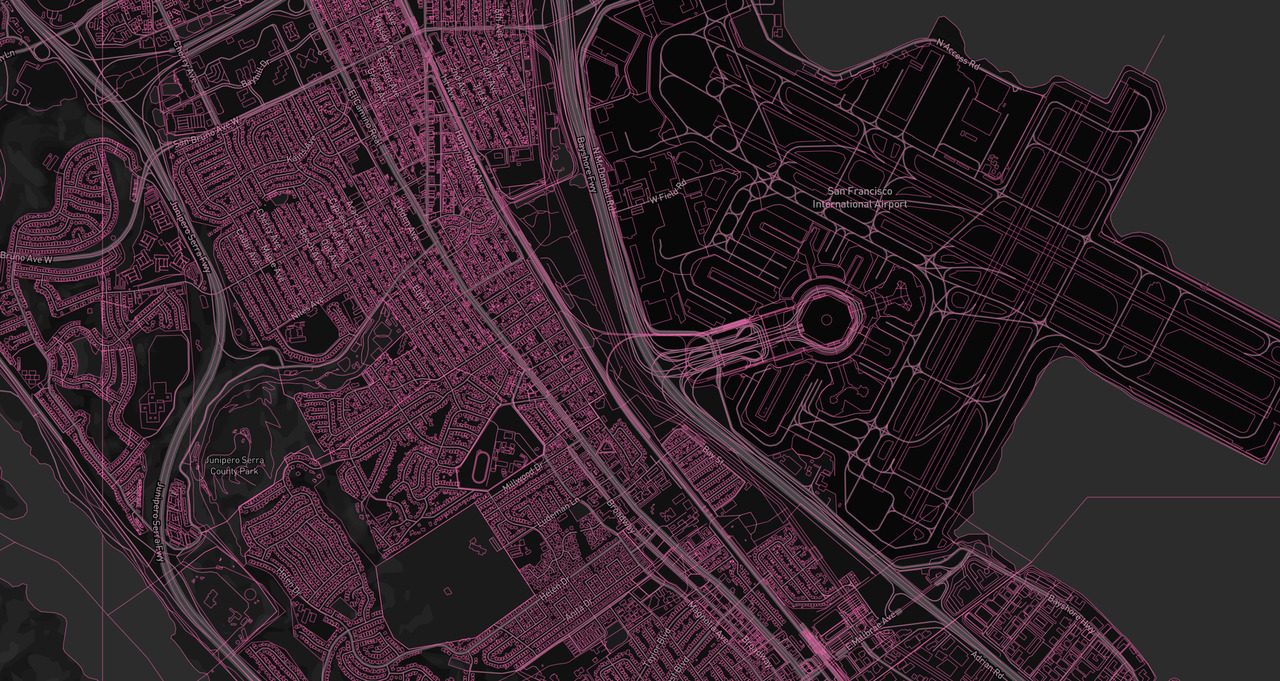
While working as a data engineer for Mapbox, I built a tool for inspecting dense geospatial files locally. This command-line program, called mbview, came pretty handy for debugging, research, and analysis.
MBTiles is an efficient file format for storing layers of data that makes a map tile. You can build them out of many sources, slices, queries, and filters. But when it comes to OpenStreetMap, the data is so rich and dense that the development cycle on a cloud editor such as Mapbox, becomes cumbersome. With mbview you can prepare your data locally and upload the final product to the Mapbox editor for further styling and deployment.
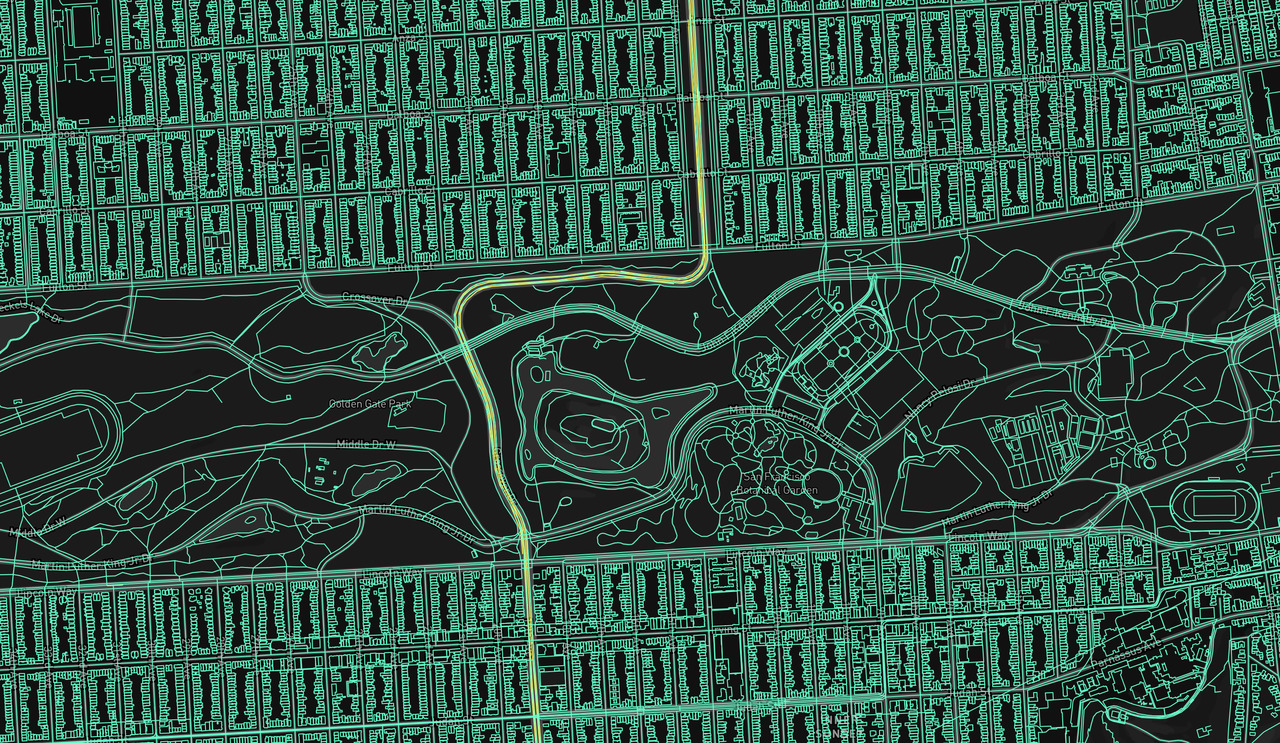
You get some pretty cool results when running dense OpenStreetMap sources. See how beautiful is the work that the mapping community has achieved over the years.
Takeaways
Designing software components as lego blocks allows you to quickly iterate over new tools. I learned this myself when I was able to put together the very first version within a day by mixing components of the Mapbox ecosystem.
OpenStreetMap is an incredible source of public data about our cities and spaces. Contributing and reusing is totally worth it.
Metadata
- project: mbview
- code: https://github.com/mapbox/mbview
- technologies: javascript, node.js, and mapbox.js
- topics: Mapbox, geospatial data, and OpenStreetMap